Abstract
Heart diseases are a major cause of mortality, currently accounting for 3 out of every 10 deaths worldwide. It has been observed that most heart diseases are associated with and reflected by the sounds that the heart produces. Thus, listening to the heart sound (also called as heart auscultation), has been a very important method for the early diagnosis of cardiac dysfunction. However, auscultation through traditional mechanical stethoscope requires sharp listening skills and clinical experience, thus limiting it to only highly trained clinical experts. Hence, using electronic processing and further computer-aided-auscultation eases the work of medical professionals and also helps in spreading the advantage of this very important technique to a greater audience. In this project, we aim to address this issue by developing a multi-channel heart sound signal acquisition system which is beneficial to both researchers and medical professionals as it facilitates easy acquisition and segmentation of patient's heart sounds. This further enables application of state of the art machine learning techniques in real time to better characterize and study the different components of the heart sound obtained.
Summary of work done
In this project, a two channel heart sound acquisition circuit has been designed stage by stage and a consolidated working model has been implemented (the two channels are used to simultaneously read heart sound data from two different valves). This data is parallel displayed on oscilloscope to study the temporal variation of the heart sound and also fed to a speaker system to aid interpretability of the signal being displayed. Further the signal obtained is discretized and fed to a compute system where a GUI application is developed to give additional information about the heart sound acquired, like the heart rate of the person being studied and also providing frequency domain analysis of the signal obtained.
1)Introduction
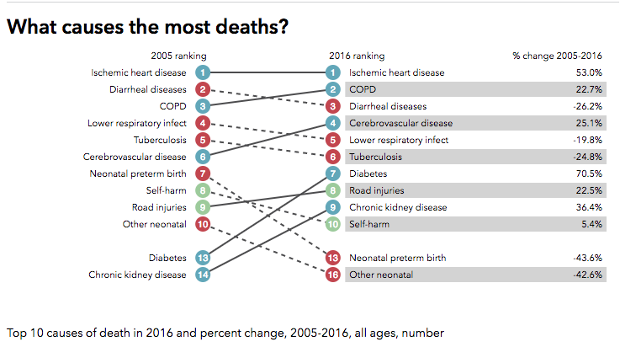
Heart disease is the leading cause of death in most countries in the world. For the specific case of India, heart diseases accounted for the death of 1.7 million Indians in 2016, according to the 2016 Global Burden of Disease Report, released on September 15, 2017
Heart diseases are a major cause of mortality, currently accounting for 3 out of every 10 deaths worldwide. It has been observed that most heart diseases are associated with and reflected by the sounds that the heart produces. Thus, listening to the heart sound (also called as heart auscultation), has been a very important method for the early diagnosis of cardiac dysfunction. However, auscultation through traditional mechanical stethoscope requires sharp listening skills and clinical experience, thus limiting it to only highly trained clinical experts. Hence, using electronic processing and further computer-aided-auscultation eases the work of medical professionals and also helps in spreading the advantage of this very important technique to a greater audience. In this project, we aim to address this issue by developing a multi-channel heart sound signal acquisition system which is beneficial to both researchers and medical professionals as it facilitates easy acquisition and segmentation of patient's heart sounds. This further enables application of state of the art machine learning techniques in real time to better characterize and study the different components of the heart sound obtained.
Summary of work done
In this project, a two channel heart sound acquisition circuit has been designed stage by stage and a consolidated working model has been implemented (the two channels are used to simultaneously read heart sound data from two different valves). This data is parallel displayed on oscilloscope to study the temporal variation of the heart sound and also fed to a speaker system to aid interpretability of the signal being displayed. Further the signal obtained is discretized and fed to a compute system where a GUI application is developed to give additional information about the heart sound acquired, like the heart rate of the person being studied and also providing frequency domain analysis of the signal obtained.
1)Introduction
Heart disease is the leading cause of death in most countries in the world. For the specific case of India, heart diseases accounted for the death of 1.7 million Indians in 2016, according to the 2016 Global Burden of Disease Report, released on September 15, 2017
Diagnosis plays a very important role in the reduction of deaths from heart diseases. The electrocardiogram (ECG) is one powerful and common screening tool for heart diseases. It is relatively inexpensive, non-invasive, and easy to use. But, it has various limitations, a prominent one being the difficulty in detecting structural abnormalities in heart valves and defects characterized by heart murmurs. Currently, various heart imaging techniques(eg echo, MRI and CT) exist in the market. However, their major disadvantages are their high cost and the need of specialized personnel to operate the complex machine. Thus, we require a cost effective and accurate method for the early detection of cardiac illnesses. Heart auscultation(defined as listening and interpretation of the heart sound) perfectly fits in the above role.
But, despite the advantages of low cost and easy operation, auscultation of the heart has been traditionally limited by three factors. Firstly, as the heart sound contains a mixture of high frequency(murmurs) and low frequency acoustic signals with low amplitude, it is highly required for the stethoscope to have a high selective sensitivity. Secondly, the heart sound data recorded with the stethoscope is often corrupted with noise, which can prohibit accurate and effective diagnosis of heart diseases. Thirdly, the interpretation of the heart sound is very subjective, and it depends largely on the experience, skills, and hearing ability of the physician. For e.g., as shown in figure below, the human ear is far more sensitive to frequencies in the speech range (800-3000 Hz) than to higher and lower frequencies. The heart sounds are primarily low-frequency vibrations that are too weak to be heard. This is the reason why digital recording and analysis of these vibrations may produce information that cannot be perceived by the physician’s ear.
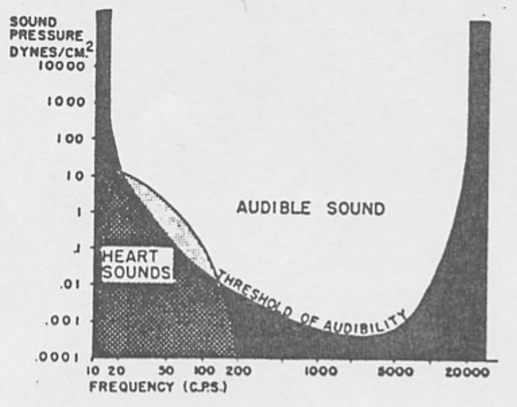
Figure: Audibility of Heart Sound
In this report, we describe the design and implementation of one such efficient heart sound acquisition circuit along with necessary additional audio and visual aids that help in better interpretability of the heart sounds obtained and also highlight methods to communicate this data collected to a compute system in real time, hence enabling use of state-of-the-art machine learning algorithms to easily detect and characterize the abnormalities in the heart sound.
The rest of the report is organized as follows: Section 2 introduces the basics of heart sounds, auscultation areas and some applications. Literature review has been presented in Section 3. Section 4 explains the design of the circuit proposed in detail; Section 5 describes a MATLAB GUI built for analyzing the heart sound data obtained and section 6 highlights some challenges faced. Final observations are presented in Section 7 and the results are presented in Section 8.
2)Theoretical Background
2.1)Introduction to heart sounds
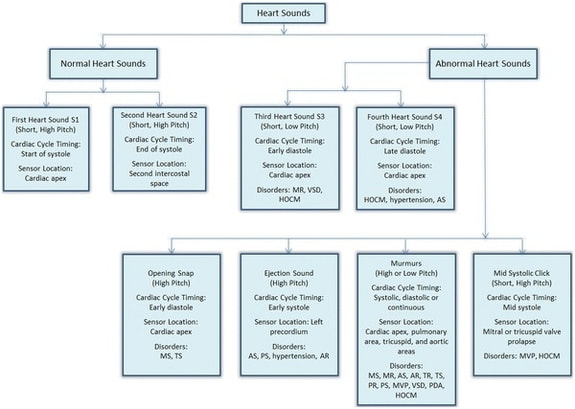
Figure: Classification of Heart Sounds
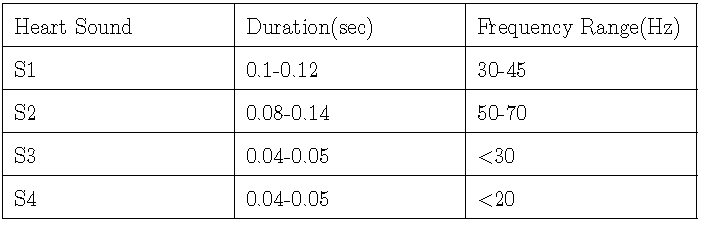
Heart sound consists of two predominant components : S1 and S2 as shown in figure above. The energy content of low-frequency vibrations of the heart is much higher than that of high-frequency vibrations. That’s why filtering is very useful to separate the low and high frequency bands. S2 has higher frequency components than S1. Some of the heart sounds (e.g. S3, S4) are very low intensity, and are only heard externally when amplified. The below table contains the detailed overview of heart sound components.
2.1.1 S1
S1 occurs at the onset of the ventricular contraction during the closure of the atrioventricular(AV) valves. It contains a series of low-frequency vibrations, and is usually the longest and loudest heart sound. The audible sub-components of S1 are those associated with the closure of each of the two AV-valves. S1 is assumed to have 4 major components: the initial vibrations occur when the first contraction of the ventricle move blood towards the atria, closing the AV-valves. The second component is caused by the abrupt tension of the closed AV-valves, decelerating the blood. The third component involves oscillation of blood between the root of the aorta and the ventricular walls, and the fourth component represents the vibrations caused by turbulence in the ejected blood flowing to the arteries. These components may be detected by time-frequency decomposition.
S1 occurs at the onset of the ventricular contraction during the closure of the atrioventricular(AV) valves. It contains a series of low-frequency vibrations, and is usually the longest and loudest heart sound. The audible sub-components of S1 are those associated with the closure of each of the two AV-valves. S1 is assumed to have 4 major components: the initial vibrations occur when the first contraction of the ventricle move blood towards the atria, closing the AV-valves. The second component is caused by the abrupt tension of the closed AV-valves, decelerating the blood. The third component involves oscillation of blood between the root of the aorta and the ventricular walls, and the fourth component represents the vibrations caused by turbulence in the ejected blood flowing to the arteries. These components may be detected by time-frequency decomposition.
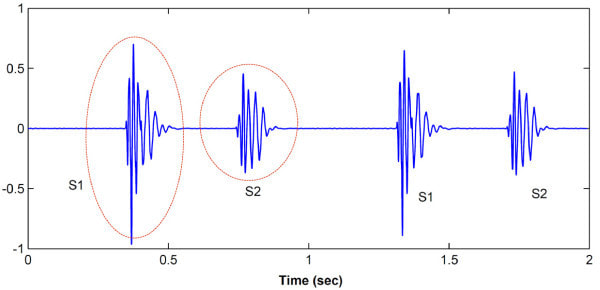
Figure: Heart Sound showing S1 and S2
2.1.2 S2
S2 is heard at the end of the ventricular systole, during the closure of the semilunar valves. Typically, its frequency is higher than S1, and its duration is shorter. It has aortic and pulmonary sub-components. The blood in the arteries, as well as the ventricles and the atria, also vibrate. The two distinct components of S2 are associated with the aortic valve (A2) and pulmonary valve (P2). Usually A2 precedes P2 by up to 30ms. These components can be widely split or reversed in pathological situations.
2.1.3 S3
A third low-frequency sound (S3, ventricular gallop) may be heard at the beginning of the diastole, during the rapid filling of the ventricles.
2.1.4 S4
A fourth heart sound (S4, atrial gallop) may be heard in late diastole during atrial contraction. Opening snaps of the mitral valve or ejection sound of the blood in the aorta may be heard in case of valve disease (stenosis, regurgitation).
2.1.5 Murmurs
Murmurs are high-frequency, noise-like sounds that are heard between the two major heart sounds during systole or diastole. They can be innocent, but can also indicate certain cardiovascular defects.
2.2 Auscultation Areas
As shown in figure below, each area emphasizes certain components of the heart sounds. The aortic area is best to hear the components of the second heart sound (aortic and pulmonary valves). The pulmonic area is best suited for hearing the pulmonary component of the second heart sound and detecting murmurs related to pulmonary stenosis and pulmonary insufficiency. The mitral area is best for detecting the murmur of the mitral insufficiency or mitral stenosis and other murmurs like third heart sound and aortic component of the second heart sound. The tricuspid area is better suited for hearing the murmurs of tricuspid stenosis and inefficiency, as well as the third heart sound and the murmurs of pulmonary insufficiency and ventricular septal defect.
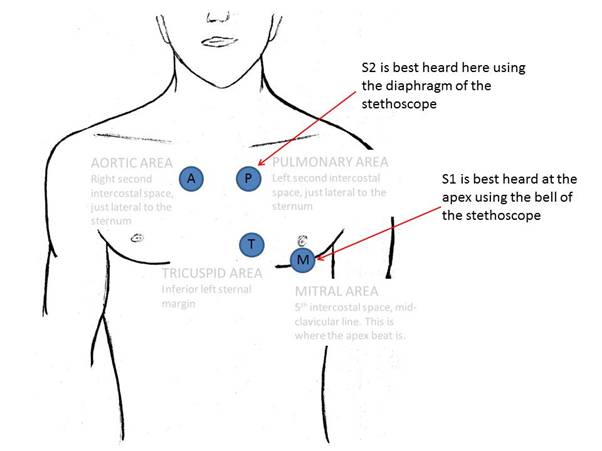
Figure: When auscultating the heart S1 and S2 are best heard in the shown places
3) Literature review
Heart auscultation has been one of the important method for the early diagnosis of heart diseases by capturing abnormal heart sounds. A phonocardiogram (PCG) is a plot of recording of the heart sounds and murmurs which provides more information about the temporal relationship between the heart sound and the mechanical and electrical events of the cardiac cycle[5]. Spectral analysis of heart sound and murmurs from PCG helps in clinical diagnosis and estimating valvular cardiac dysfunction[6]. However, the quality of the detection of heart sounds depend on various factors such as patient's body size, obesity, chest hair, noise in the environment, proper placement of stethoscope, and listening skill of the physician. Therefore the need for advancement of heart auscultation is highly evident.
Gabarda et al [8] carried out a study which states that mechanical processes in the body produce sounds which indicate health of an individual and gives valuable information about patient's cardiovascular condition. Amin and Fethi[9] observed that the auscultation of heart sound is one of the important analysis tool to evaluate functional state of the heart. Normal heart sounds are produced by closure of heart valves while the murmurs are produced by turbulent blood flow caused by narrowing or leaking valves [9,10]. Typical conditions in the cardiovascular system which cause blood flow turbulence are local obstructions, shunts, abrupt changes in diameter, and valve insufficiency.
In [7] Macartney states that the increasing motivation for an improved approach to clinical diagnosis is efficient computing modelling of diagnostic process which is essentially based on digital signal processing techniques. Signal processing techniques has been extensively applied on heart sound signals for the characterization of cardiac sounds and murmur[9,10,11]. According to Amin and Fethi [9], the S1 and S2 sound and their characteristics can be accurately measured by digital signal processing techniques.
4) Proposed Approach
In this project, we have used conventional stethoscope coupled to an electret microphone. The stethoscope system detecting chest sounds has two main blocks: Signal Acquisition and Signal Conditioning. The signal is sensed by the sensor and then pre-amplified, filtered and then it is given to a power amplifier, which in turn drives the output speaker. The above description corresponds to functioning of a single channel. Two such channels have been implemented. Schematic of a single channel is shown in figure below
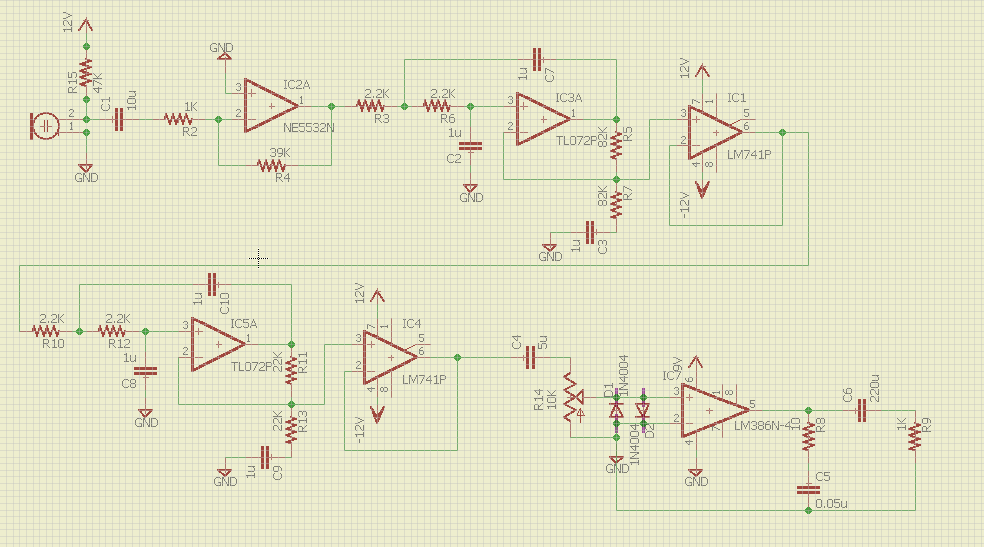
Figure: Circuit Schematic
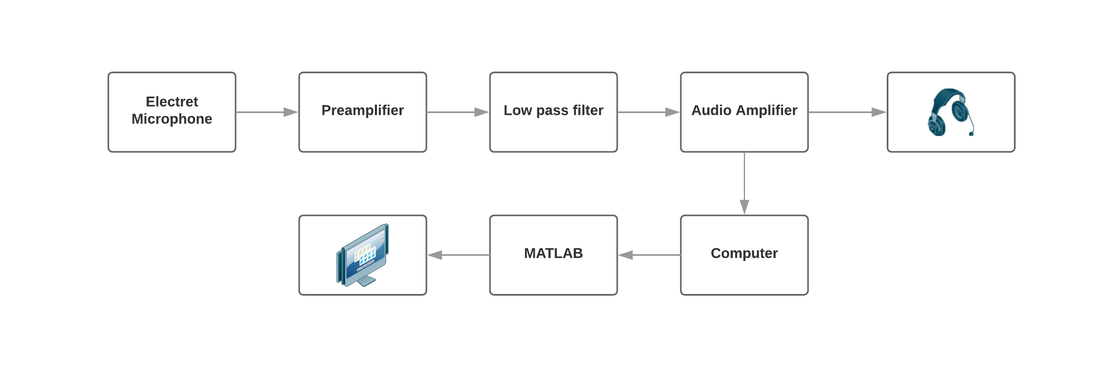
Figure: Schematic diagram showing different stages
4.1 Preamplifier
The microphone is biased by connecting it to 12V through a 47k omega resistor. The signal is sent to a preamplifier which consists of a inverting amplifier of gain Av=39. The function of a preamplifier is to convert a weak electrical signal into an output signal strong enough to be noise tolerant and strong enough for further processing. NE5532 was used for opamp as it has very-low noise, high output-drive capability and high slew rate.
The microphone is biased by connecting it to 12V through a 47k omega resistor. The signal is sent to a preamplifier which consists of a inverting amplifier of gain Av=39. The function of a preamplifier is to convert a weak electrical signal into an output signal strong enough to be noise tolerant and strong enough for further processing. NE5532 was used for opamp as it has very-low noise, high output-drive capability and high slew rate.
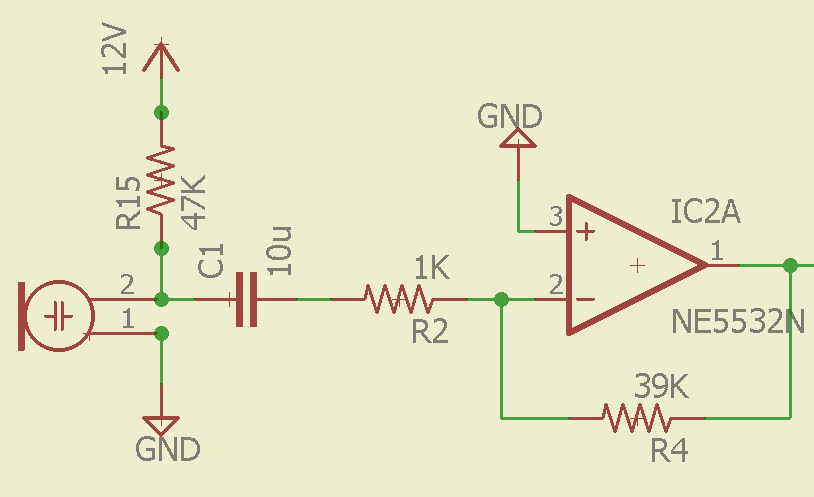
Figure:Preamplifier Circuit
4.2 Filtering
Heart sounds are mostly contained in frequencies less than 70Hz. A 4th order low pass filter of cutoff frequency of 73Hz was used to remove noise frequency components, leading to following resistance and capacitance values: R1 = R2 = 2.2 k , RA = RB = 82 k, C1= C2 = 1 micro F . Two 2nd order butterworth filters were concatenated to make a 4th order low pass filter. Between each stage, a bu er is added for impedance matching and prevent loading. 4th order filter was necessary to ensure a steeper roll-o . Brief circuit and parameters of a second order low pass filter are shown in figure below. LM741 IC was used for the voltage buffer(voltage follower) stage, and TL072 IC(JFET input OpAmp) was used for constructing the butterworth filter since it has desirable features like low noise, high slew rates and low harmonic distortion.
Heart sounds are mostly contained in frequencies less than 70Hz. A 4th order low pass filter of cutoff frequency of 73Hz was used to remove noise frequency components, leading to following resistance and capacitance values: R1 = R2 = 2.2 k , RA = RB = 82 k, C1= C2 = 1 micro F . Two 2nd order butterworth filters were concatenated to make a 4th order low pass filter. Between each stage, a bu er is added for impedance matching and prevent loading. 4th order filter was necessary to ensure a steeper roll-o . Brief circuit and parameters of a second order low pass filter are shown in figure below. LM741 IC was used for the voltage buffer(voltage follower) stage, and TL072 IC(JFET input OpAmp) was used for constructing the butterworth filter since it has desirable features like low noise, high slew rates and low harmonic distortion.
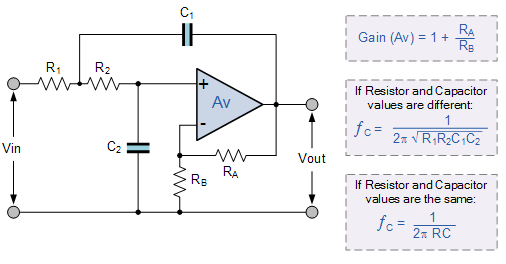
Figure: 2nd order Butterworth filter
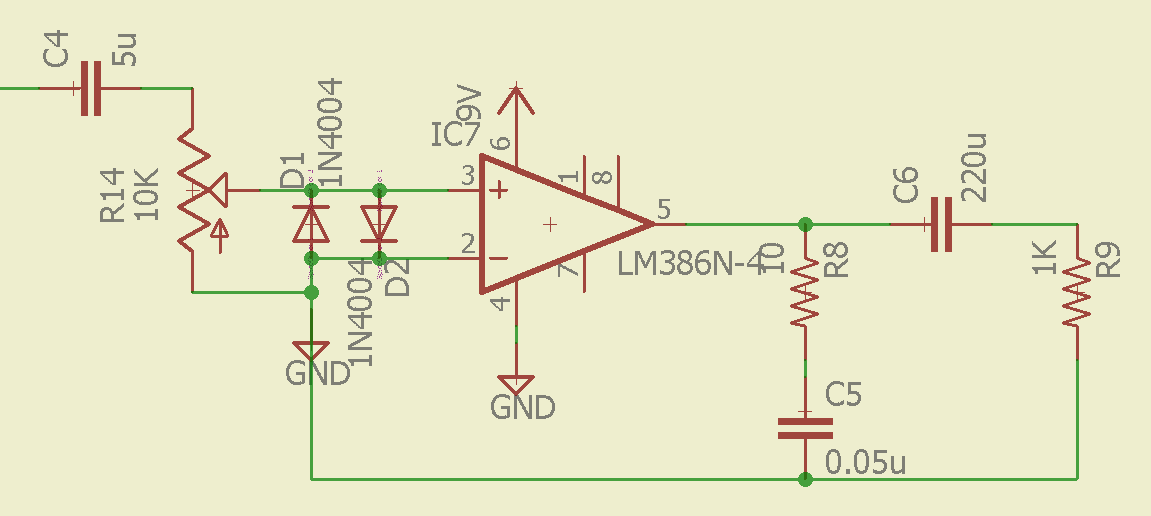
Figure: Low Pass Filter as implemented
4.3 Audio Power Amplifier
Audio Power amplifier is required to reproduce low-power heart sounds at a level that is strong enough for driving loudspeakers or headphones. Output of previous filtering stage is fed to a voltage buffer(LM741 was used) before being fed to a power amplifier. This is the last stage in the signal conditioning for which LM386 is used. LM386 is a low voltage audio power amplifier. The gain of power amplifier has been kept variable with the help of potentiometer. The circuit used is as shown in figure below. In addition, protection diodes have been used before input to LM386 to prevent unwanted damage. Output of power amplifier can be used to connect to a speaker.
Audio Power amplifier is required to reproduce low-power heart sounds at a level that is strong enough for driving loudspeakers or headphones. Output of previous filtering stage is fed to a voltage buffer(LM741 was used) before being fed to a power amplifier. This is the last stage in the signal conditioning for which LM386 is used. LM386 is a low voltage audio power amplifier. The gain of power amplifier has been kept variable with the help of potentiometer. The circuit used is as shown in figure below. In addition, protection diodes have been used before input to LM386 to prevent unwanted damage. Output of power amplifier can be used to connect to a speaker.
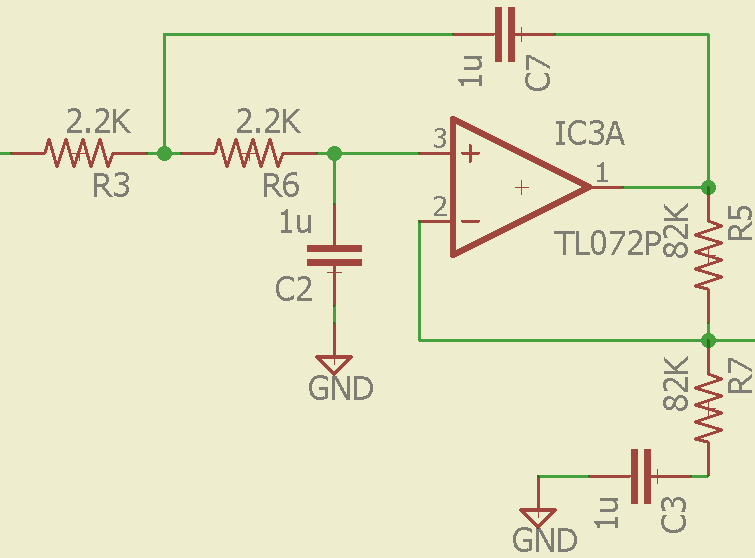
Figure: Audio Amplifier
5) MATLAB GUI
The output of power amplifier is fed to a computer system via 3.5 mm audio jack. The audio port of the computer system has a built-in sampler which discretized the analog heart sound signal. Further processing of heart sound signal can be done on MATLAB using digital signal processing techniques.
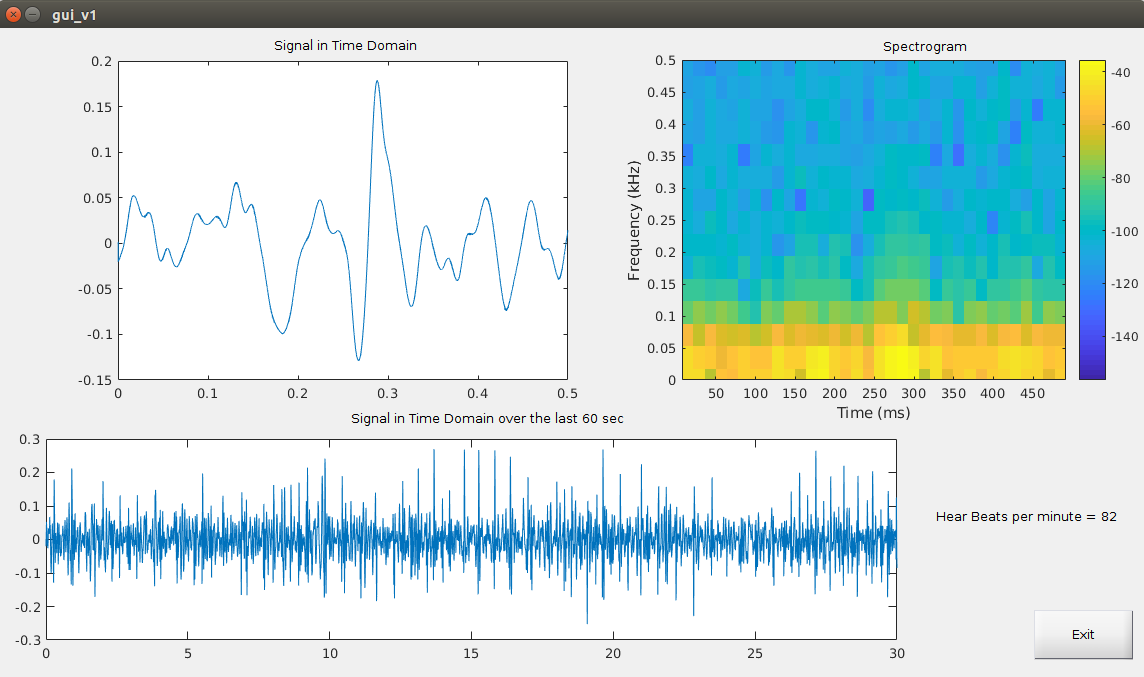
A MATLAB GUI application as shown in figure below has been designed to view the heart sound signal signal and its spectrogram on computer in real-time. The interface also displays the heart rate of the person in BPM (beats per minute).
The output of power amplifier is fed to a computer system via 3.5 mm audio jack. The audio port of the computer system has a built-in sampler which discretized the analog heart sound signal. Further processing of heart sound signal can be done on MATLAB using digital signal processing techniques.
A MATLAB GUI application as shown in figure below has been designed to view the heart sound signal signal and its spectrogram on computer in real-time. The interface also displays the heart rate of the person in BPM (beats per minute).
GUI Application
6) Challenges faced and how they were tackled
7) Observations
The acquired heart sound signal , final circuit with appropriate labels and final circuit design are shown below:
- Careful impedance matching was required while connecting different parts of the circuit so as to ensure loading effect didn't take place. Buffers were inserted at appropriate positions to take care of this error
- A simple 2nd order doesn't have a sharp enough high frequency drop to give satisfactory results in our given circuit. Thus a 4th order low pass filter was designed to give appropriate low pass action such that the heart sounds can be separated from noise efficiently.
- Careful design of Audio power amplifier is necessary to efficiently play the heart sounds as achieved via speaker. Multiple design methodologies were tested keeping in mind the input resistance and maximum input amplitude to the speaker.
- Since a simple mechanical stethoscope is utilized to capture the mechanical vibrations caused due to heart sound and convert that to air pressure variations, an electret microphone is used as a transducer to convert these variations to electrical signals. Hence special sealed rubber tubes were used to direct all pressure vibrations from the diaphragm of the stethoscope to the microphone, thus improving the signal strength .
- Heart sound signals obtained via the mechanical stethoscope and further converted to electrical signals using an electret microphone is is highly susceptible to noise thus required the use of special audio cables (shielded twisted wire cables) to transfer the signal robustly to the signal processing circuit.
- Transfer of electrical signal obtained via hardware signal processing using our designed circuit to MATLAB is done via the 3.5mm headset jack on the laptop. The mic input of 3.5mm jack has an input voltage limitation of [-0.5V, 0.5V], hence the output of power amplifier had to be passed through an opamp stage of fraction gain(A{v=1/40) to bring the signal into our desired range.
7) Observations
The acquired heart sound signal , final circuit with appropriate labels and final circuit design are shown below:
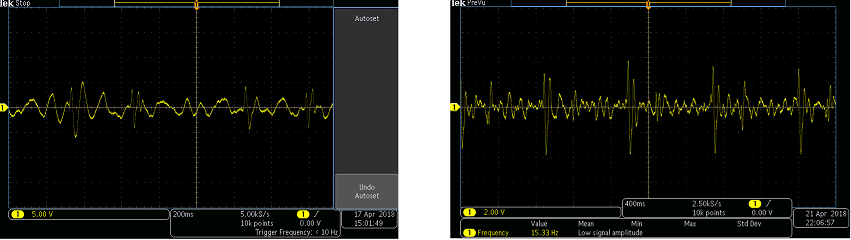
Figure: Acquired Heart sound signal shown for different time base settings
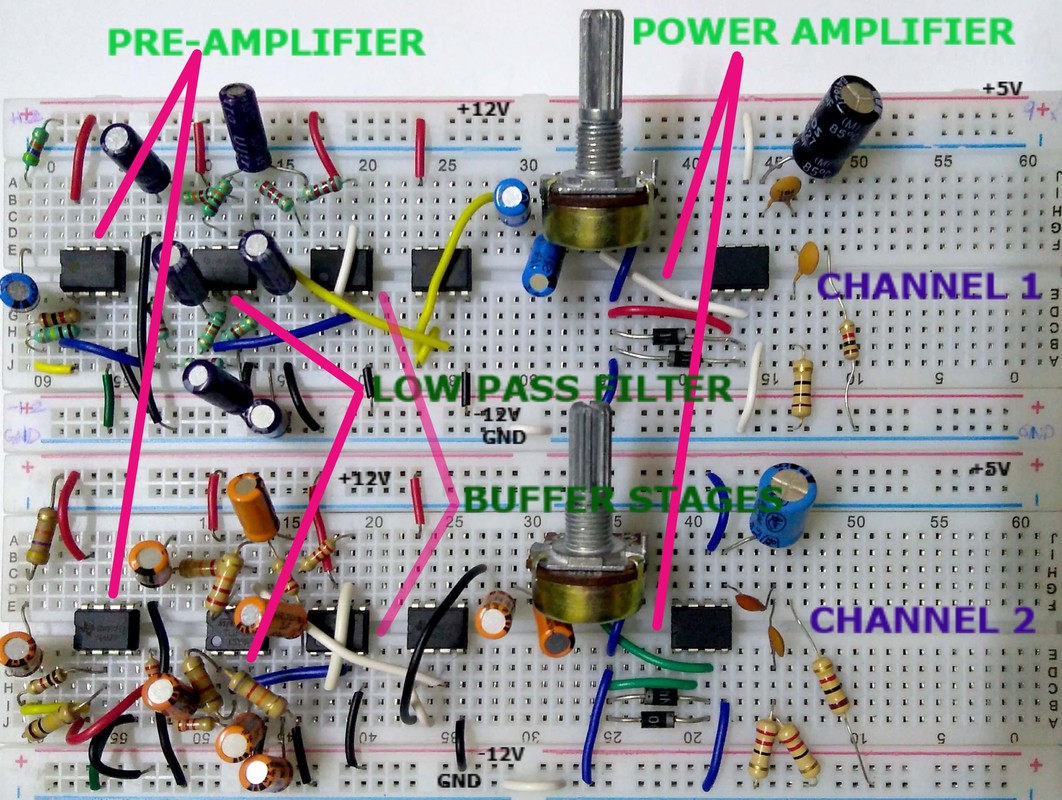
Figure: Final Circuit as implemented along with appropriate labellings
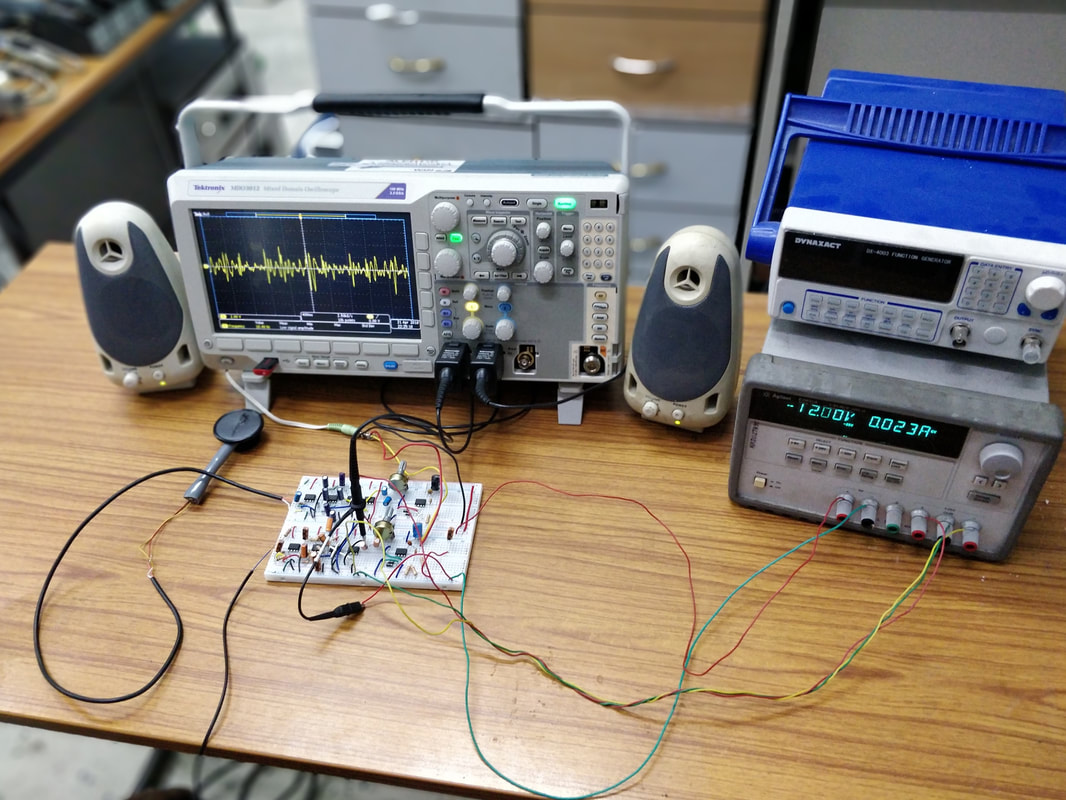
Figure: The complete system
8)Results
We have successfully implemented a two channel heart sound signal acquisition circuit using which heart sound data, from two positions on the chest, can be recorded parallely. After sensing the signal from electret microphone, the pre-amplifier is successfully able to convert the weak electrical signal obtained from transducer into an output signal strong enough to be noise tolerant and strong enough for further processing. Further, the designed 4th order low pass filter, obtained by cascading two 2nd order Butterworth filters, gave a cut-off frequency of roughly 85 Hz which was sufficiently close to the designed value and hence was shown to attenuate unnecessary out of band frequency components. The output from the audio amplifier was fed to a speaker, separately for each channel, and the heart sound (lub-dub) was heard clearly. Also the output was successfully transfered to a computer system for processing in MATLAB. The MATLAB GUI application correctly showed the last 30 seconds data of the acquired heart sound signal, the heart rate of the person in real-time, the last 0.5 seconds of the acquired data and its spectrogram to analyze local variations in the signal.
Our implementation of this heart sound acquisition device costs less than 500rs per channel. The electronic stethoscopes available in the market are still quite expensive and hence not so popular. So our motivation is to develop low-cost implementation of the electronic stethoscope to promote its usage in the general health-care industry
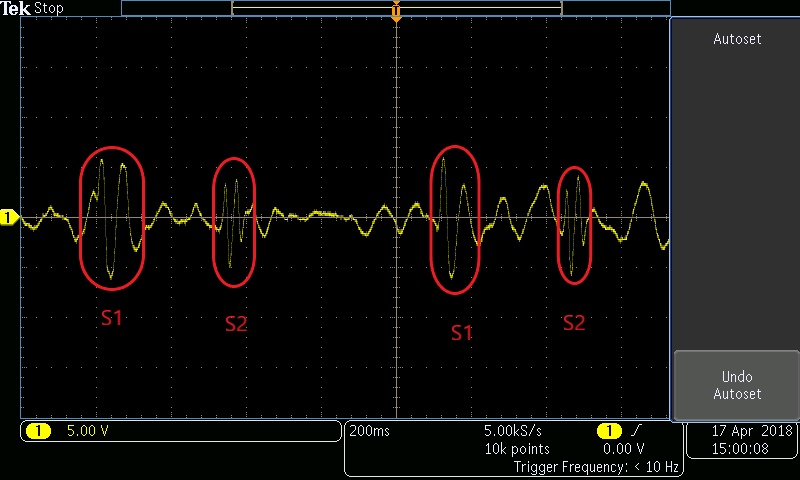
Figure: S1 and S2 components in the acquired signal
9)Future Work
- Given our current work of real time analysis of the discretized heart sound signal obtained, we would next like to look at software level implementation of state-of-the-art machine learning based heart sound anomaly detection algorithms. A dataset which we can be used for training the ML model for classifying heartbeat anomalies from stethoscope audio can be found at https://www.kaggle.com/kinguistics/heartbeat-sounds/data
- Along the lines of our aim of building a robust product that can be easily used by researchers/ doctors, we would now look to transfer the circuit to a PCB board and use a raspberry pi 3 as the compute system for the software analysis.
10) Video of the working system
11) References
Please refer to the following document for the references:
